
Construction Procurement KPIs: What to Track and What Each Number Is Telling You
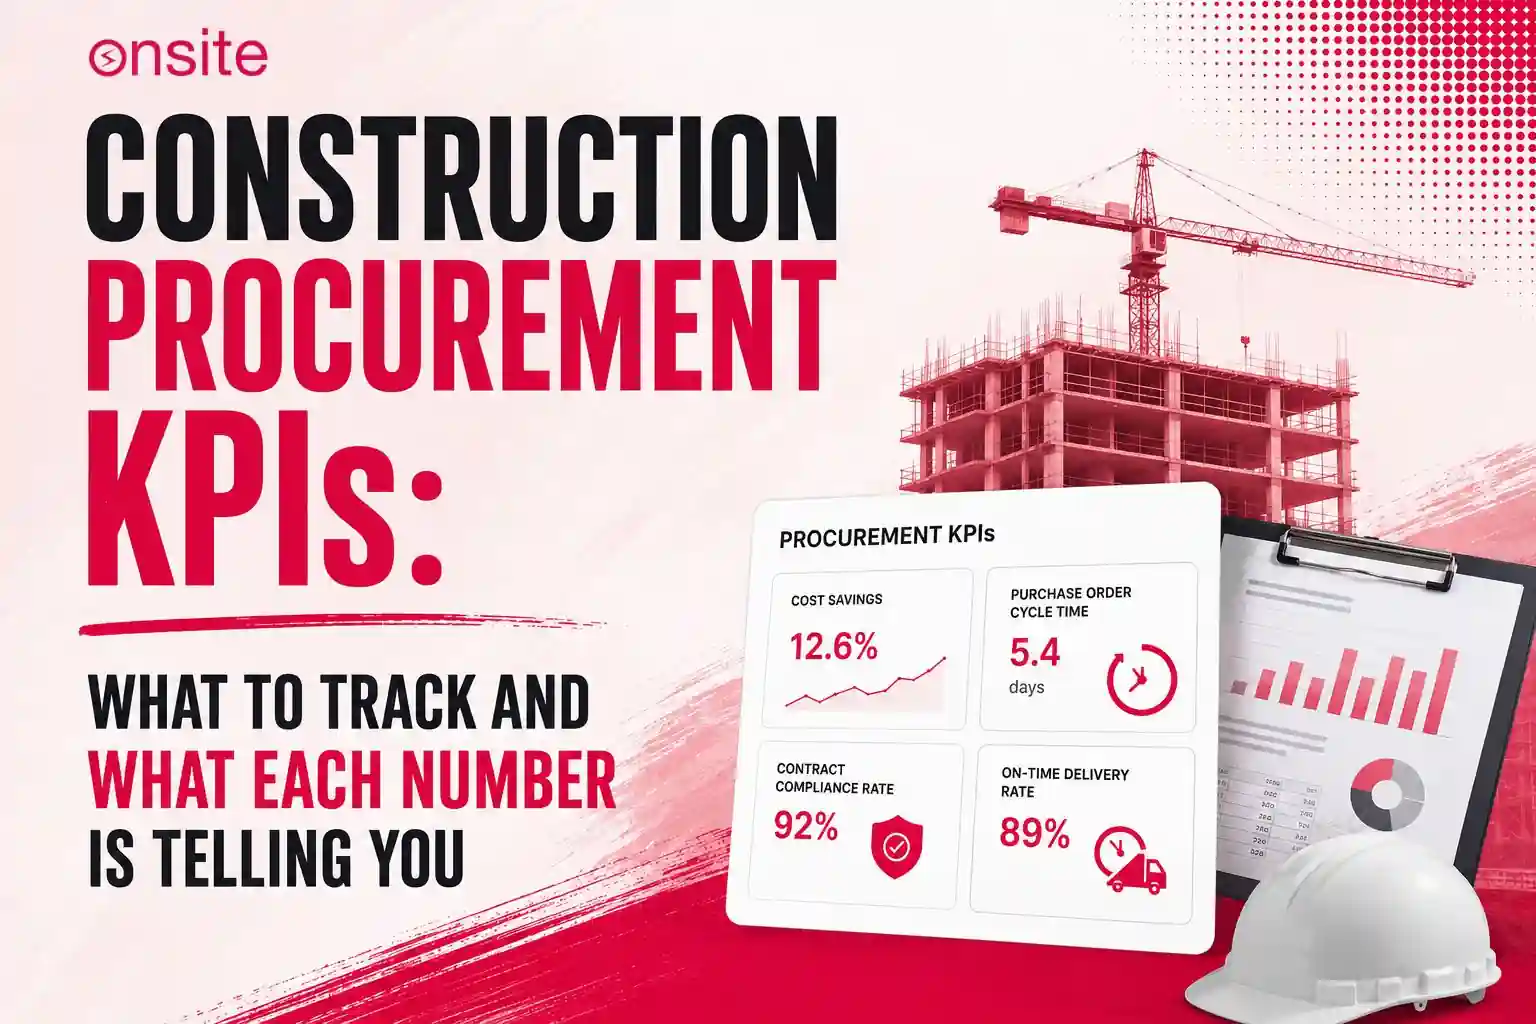
Construction procurement KPIs are measurable indicators that help track how effectively a construction company manages its purchasing functions. They cover each step of the procurement process, including vendor reliability, purchase order discipline, material delivery accuracy, rate variance against estimates, and contract spending. Financial KPIs measure costs, including overall costs at closeout. However, procurement KPIs are leading indicators. They help identify problems before any mishap becomes difficult to undo.
Quick Answer: What Are the Most Important Construction Procurement KPIs?
There are nine procurement KPIs that matter most in construction. They are On-Time Delivery Rate, Requisition-to-PO Cycle Time, Rate Variance, Maverick Spend Percentage, Vendor On-Time Delivery Rate by vendor, Material Return and Rejection Rate, Material Utilization Rate, Days Payable Outstanding, and Contract Compliance Rate. Each one acts as a leading indicator. It helps identify the cause of a problem before it becomes a larger issue and reaches the project P&L. These KPIs make you aware of potential problems while corrective action is still possible.
Industry Insight: The Chartered Institute of Procurement and Supply (CIPS) defines effective procurement around five dimensions known as the Five Rights: the Right Quality, Right Quantity, Right Price, Right Time, and Right Place. Research from procurement professionals across industries consistently shows that cost savings, the most commonly tracked procurement KPI, accounts for only one of these five dimensions. Organisations that track only cost savings are measuring one fifth of what procurement performance actually covers. Source: Chartered Institute of Procurement and Supply – Five Rights of Procurement
The construction contract may have specified a maximum annual escalation of 3%, but suddenly the vendor sends a revision letter claiming a 12% increase in rates. The procurement manager might sign it without checking the original agreement, and this is not unusual. It happens regularly on construction projects.
A vendor sends revised rates, citing steel price movements, increased diesel costs, or general market escalation. The revision is then accepted informally because the acknowledgement is signed without checking the original agreement. Once it is signed, the original agreed rate may become irrelevant because there was no system tracking the gap between what was agreed and what was actually being paid.
Construction procurement KPIs exist to catch these kinds of problems before the revised rate has been running for six months and the project P&L shows an unexplained cost overrun that can be traced back to a letter someone should have challenged in the first week.
Why Procurement Is the One Function Most Construction Companies Don’t Measure
A construction project manager often knows almost everything happening on site. Ask about the labour cost percentage, and he will probably know it. Ask about the subcontractor billing status, and he can tell you immediately.
But ask, “What is the on-time delivery rate for this project’s cement vendor?” and he may have to think twice before answering.
This happens because procurement is often treated simply as a logistics function. The focus is on getting materials to the site. But procurement also needs to be measured more closely. Did the material arrive on the committed date? Was the agreed quantity delivered? Did it reach the right location and meet the required quality?
The bigger problem is that procurement failures often do not appear in procurement reports. They eventually appear in cost reports as overruns, often without a clear explanation. By the time anyone notices that material expenses are running 11% above budget, the decisions that created the gap may have been spread across dozens of individual purchases over three months.
Nobody noticed that 18% of purchases on the project were bypassing the purchase order process. Nobody flagged it.
The cost report shows the outcome. Procurement KPIs can show what is causing it while there is still time to investigate and take corrective action.
The 5 Rights of Procurement And Why Indian Construction Sites Are Missing Four of Them
The Chartered Institute of Procurement and Supply defines effective procurement around five rights: Right Quality, Right Quantity, Right Price, Right Time, and Right Place.
However, most construction procurement processes focus primarily on the right price. The main question is often, Was the material rate lower than the estimate? The other four are often ignored or have no formal measurement.
Each missed right creates a specific and measurable cost on the construction site.
What happens when the right time is missed?
When material arrives late at the site, it directly affects productivity. Workers are present and the activity is scheduled, but the required material is not available. This leaves workers idle while their wages continue to be paid, even though no productive work is being completed. It can also delay the project schedule. If the labour cost for a day is ₹700 per worker and 25 workers are present, a single idle day can cost ₹17,500 in labour alone.
What happens when the right quantity is missed?
Duplicate orders can create excess inventory that ties up working capital. A shortage of material, on the other hand, can force an emergency purchase from whichever vendor can supply it fastest. This can lead to higher material costs and budget overruns. For example, 100 bags of cement may be ordered, but if nobody checks that the vendor delivered only 98 bags, the shortage may only be discovered later, forcing an emergency purchase.
What happens when the right quality is missed?
The material may reach the site but fail to meet the required quality or specifications. This can result in rejection, rework, or replacement. The cost can include return logistics, procurement delays, idle time while waiting for replacement material, and, in some cases, specification disputes that delay billing certification.
What happens when the right place is missed?
Material delivered to the wrong site may require an inter-site transfer, creating unbudgeted transport and handling costs that later appear in the project P&L without an obvious source.
Construction Procurement KPIs 1: On-Time Delivery Rate
Formula: (Deliveries received on or before committed date ÷ Total deliveries) × 100 Warning threshold: Below 70% What it reveals: Vendor reliability and procurement planning discipline Review cadence: Weekly
Material arriving at the site is not enough. It is necessary that the material arrives on or before the committed delivery date stated in the purchase order.
This is important because late deliveries can create several problems. When material does not arrive on time, site activities may be delayed and labour can be left idle, creating unnecessary costs for the project.
However, in many cases, the actual delivery date is never formally compared with the committed date. The arrival may be recorded, but no one measures whether the material was delivered on time. This happens because the KPI does not exist in the contractor’s regular procurement review.
A site may receive materials on time only 60% of the time, while 40% of deliveries are delayed. Those delays can stall planned activities and leave labour waiting for materials.
When the On-Time Delivery Rate falls below 70%, there are several questions that should be answered before the next major procurement cycle:
Which vendors are consistently delivering late?
Which activities are being planned without sufficient lead time for material procurement?
Are delays occurring because of late vendor deliveries, delayed approvals, or late material requests?
Construction Procurement KPIs 2: Requisition-to-PO Cycle Time
Formula: Average calendar days from material request submission to purchase order issued to vendor Warning threshold: Above 3 working days for standard materials; above 7 days for any material What it reveals: Whether the approval chain is the bottleneck, not the vendor Review cadence: Weekly
The delay often goes unnoticed because most material requests are made on WhatsApp. The approval is also given informally through WhatsApp, and there is no formal submission timestamp. A cycle time cannot be measured without knowing when the request was formally submitted and when it was approved.
There should be a structured material request process that records when the material was requested and when it was approved. This KPI reveals two things. First, it measures the time taken by the procurement approval process. Second, it reveals whether a proper procurement process exists at all.
If a site is operating mainly through WhatsApp approvals, there may be no reliable data from which this number can be calculated.
A Requisition-to-PO Cycle Time of more than three working days for standard materials such as cement, steel, and aggregate can mean that the vendor is still waiting for a confirmed order while the site continues operating on existing stock that may not last.
When this happens, the problem is not always the vendor’s delivery performance. The delay may have started within the contractor’s own approval process. The solution is to identify and fix those internal delays so that the purchase order reaches the vendor early enough for the material to arrive on the committed delivery date.
Construction Procurement KPIs 3: Rate Variance
Formula: ((Actual purchase rate − BOQ estimated rate) ÷ BOQ estimated rate) × 100 Warning threshold: Consistent positive variance above 5% for any major material category What it reveals: Whether BOQ estimates are accurate and whether negotiation is happening before commitment Review cadence: Per purchase, reviewed monthly in aggregate
This is the KPI that would have caught the escalation letter. A vendor sends a revised rate with a 12% increase, while the contract permits only a 3% annual escalation.
A contractor who tracks Rate Variance has a documented reference point, such as the BOQ estimate, agreed contract rate, or purchase order rate. A contractor who does not track rate variance may have no systematic record of what rate was originally agreed, which vendors are causing deviations, or how much those deviations are costing across the project.
Rate variance should not be calculated only at the end of the month. It needs to be identified while the purchase is being made. Every purchase raised at a rate different from the BOQ estimate should create a variance entry. This helps identify which material categories are consistently running above estimate and whether the cause is market movement, an inaccurate estimate, or poor procurement control.
If a major material category shows a consistent positive variance of more than 5% for three consecutive months, it should not simply be dismissed as a market problem. There may be a weakness in the procurement process. Either the BOQ estimate was incorrect at the time of project planning, or the procurement team is purchasing without checking the agreed or estimated rate.
Construction Procurement KPIs 4: Maverick Spend Percentage
Formula: (Spend made outside approved PO process ÷ Total procurement spend) × 100 Warning threshold: Above 15% What it reveals: How much procurement is bypassing rate negotiation, vendor comparison, and budget checks simultaneously Review cadence: Monthly
Maverick spend is a formal procurement term. In Indian construction practice, it is often seen as emergency purchases, cash purchases, or procurement carried out through WhatsApp without following the formal process.
It refers to spending that bypasses the approved purchase order process. There may be no comparison between vendors, no rate check against the BOQ, and no budget approval before the commitment is made.
Procurement professionals often track Spend Under Management, which is the inverse of maverick spend, because spending that follows a formal procurement process can be reviewed, compared, and controlled. Each formal purchase creates an opportunity to compare vendors, negotiate rates, and check the purchase against the available budget. A maverick purchase removes those opportunities.
Avoiding maverick spend requires the procurement process to be followed consistently. On many Indian construction sites, a significant portion of material spending can take place without a formal purchase order or documented approval. Each of these purchases reduces the contractor’s ability to compare vendors, verify rates, and check whether the spending is within budget.
The combined financial impact can become one of the largest correctable procurement losses on an active project.
Construction Procurement KPIs 5: Vendor On-Time Delivery Rate (Tracked Per Vendor, Not Aggregate)
Formula: (On-time deliveries from Vendor X ÷ Total deliveries from Vendor X) × 100 – calculated separately for each vendor Warning threshold: Any individual vendor below 60% What it reveals: Which specific supplier relationships are creating schedule risk, independent of aggregate performance Review cadence: Monthly per vendor
From a broader perspective, an aggregate on-time delivery rate of 75% may look acceptable. However, it can hide an important problem. One vendor may be delivering on time 95% of the time, while another is delivering on time only 30% of the time. The aggregate figure hides that difference.
Tracking delivery performance by vendor makes the problem visible. A vendor with an on-time delivery rate of only 30% should not be relied upon for critical-path materials, regardless of how competitive the rate may be.
A contractor who maintains this data knows which vendors are reliable for time-sensitive requirements. A contractor who only knows the overall delivery performance across all vendors does not.
On many construction sites, contractors continue working with three to five trusted vendors based largely on long-standing relationships rather than current performance data. Those relationships may be genuine and valuable, but there is an important difference between a relationship and measurable performance.
A vendor may have supplied materials successfully for five years but seen its on-time delivery performance decline after taking on more clients. The relationship does not automatically reveal that change. A vendor-level KPI does.
Construction Procurement KPIs 6: Material Utilization Rate
Formula: (Material consumed for recorded site activities ÷ Material received at site) × 100 Warning threshold: Below 85% for cement, steel, or any material with a defined consumption rate per unit of work What it reveals: Whether received material is being used productively or is being lost to wastage, pilferage, or unrecorded consumption Review cadence: Monthly per material category
There is a significant difference between material ordered and material consumed. Many Indian construction sites carefully track the quantity received, but do not compare it with the quantity actually used for specific BOQ activities.
If the quantity of material received on site is significantly higher than the quantity consumed, the gap needs an explanation. Material consumption should also remain within the expected wastage allowance for that particular material.
Standard wastage allowances can provide a baseline for comparison:
- Cement: 2% to 3% of net theoretical volume
- Steel reinforcement: 3% to 5% for offcuts and laps
- Brickwork: 5% to 10% for breakage and cutting
- Tiles and stone: 10% to 15% for cuts and pattern matching
For example, if cement or steel consumption is 15% above the theoretical requirement, while standard wastage should account for only 2% to 5%, the difference requires scrutiny. It may indicate untracked material loss, excessive wastage, or consumption on activities that are not being properly recorded against the project BOQ.
The same cross-reference logic used to identify inflated muster rolls can also be applied here. If the reported labour headcount and activity progress suggest that a certain quantity of cement should have been consumed during a given week, but actual consumption is significantly higher, the excess requires a specific explanation.
Without Material Utilization Rate as a tracked KPI, that excess can simply disappear into the overall project cost without ever being questioned.
Construction Procurement KPIs 7: Days Payable Outstanding (DPO)
Formula: (Accounts payable balance ÷ Total procurement spend) × Number of days in period Warning threshold: DPO declining over consecutive months without a corresponding change in contract terms What it reveals: Whether payment timing is being managed deliberately or happening by default Review cadence: Monthly
The only way to create savings through procurement is not rate negotiation. Payment terms can also create significant financial value.
For example, a cement supplier may charge ₹380 per bag with payment due in seven days. If the supplier is unwilling to reduce the rate, the contractor may still negotiate to keep the same rate while extending the payment period to 30 days. This gives the contractor an additional 23 days to use that cash.
For contractors managing multiple projects and facing constant working capital pressure, those additional 23 days can make a real difference. They can help keep site operations running smoothly instead of forcing emergency borrowing, delayed payments, or other short-term cash arrangements before the next client payment is received.
If Days Payable Outstanding (DPO) is consistently declining without any change in agreed supplier payment terms, it may indicate that the contractor is paying suppliers faster than required. This can unnecessarily reduce working capital and create cash pressure earlier in the project cycle.
Construction Procurement KPIs 8: Contract Compliance Rate
Formula: (Spend at contracted or PO-agreed rates ÷ Total relevant spend) × 100 Warning threshold: Below 90% – more than 10% of spend at rates different from what was agreed What it reveals: Whether agreed rates are being honoured through execution or being silently revised Review cadence: Per invoice, reviewed monthly in aggregate
This is the KPI that the escalation letter example is really about. The contract may allow only a 3% annual escalation, but the vendor sends a letter claiming a 12% increase. A manager might sign it without checking the original agreement.
If Contract Compliance Rate is tracked, every invoice can be compared against the agreed BOQ or purchase order rate before payment is processed. The discrepancy becomes visible immediately. If the claimed rate does not match the agreed rate or permitted escalation, the invoice should be held until the difference is clarified.
This prevents the contractor or manager from simply approving the 12% increase without understanding its contractual basis. In the absence of this KPI, the invoice may be processed and the payment made. Three months later, the cost report may show that material costs are over budget, but by then the decision that created the overrun has already been approved.
On Indian construction sites, rate revisions often arrive through a WhatsApp message or as a cover letter attached to an invoice. The revised rate may not clearly refer to the original purchase order rate. Even when it does, the two rates are rarely compared systematically. In some cases, the vendor relationship is given more importance than the contractual number.
Construction Procurement KPI Reference Table
| KPI | Formula | Warning Threshold | What It Reveals | Cadence |
|---|---|---|---|---|
| On-Time Delivery Rate | On-time ÷ total deliveries × 100 | Below 70% | Vendor reliability | Weekly |
| Requisition-to-PO Cycle Time | Days from request to PO issued | Above 3 days | Approval bottleneck | Weekly |
| Rate Variance | (Actual − BOQ rate) ÷ BOQ rate × 100 | Above 5% consistently | Estimation or negotiation gap | Per purchase |
| Maverick Spend % | Non-PO spend ÷ total spend × 100 | Above 15% | Process discipline | Monthly |
| Vendor On-Time Rate | Per-vendor on-time ÷ total × 100 | Any vendor below 60% | Supplier schedule risk | Monthly per vendor |
| Material Utilization Rate | Consumed ÷ received × 100 | Below 85% | Wastage or unrecorded use | Monthly |
| Days Payable Outstanding | AP ÷ spend × days in period | Declining without reason | Working capital management | Monthly |
| Contract Compliance Rate | Spend at agreed rate ÷ total × 100 | Below 90% | Rate discipline at invoice | Per invoice |
What Each KPI Should Trigger: The Action Protocol
If a KPI does not lead to action, it is simply a reporting exercise. The value of tracking procurement performance is not just in knowing the number. It lies in deciding what to do when that number crosses a specific threshold.
For each threshold in this article, a specific action should follow.
On-Time Delivery Rate below 70%
Before placing the next order for critical materials, review vendor performance. Identify which vendors are consistently late and which vendors have a strong on-time delivery record. Vendors with poor delivery performance should be removed from the supply of critical materials for the current project phase.
Requisition-to-PO Cycle Time above 3 days
Map the approval process for the last five purchase orders and identify where the delay occurred. If the delay is consistently with a specific approver, assign a designated alternate or revise the approval authority. If the delay occurs at the submission stage, the request process or format may be creating confusion and needs to be simplified.
Rate Variance above 5% for a major material category
Check the last three invoices against the agreed purchase order rates before processing the next payment. If the variance is consistent and cannot be clearly explained, obtain written justification from the vendor. From that point onwards, any further rate change should require a formal variation or approval before payment is released.
Maverick Spend above 15%
Identify which sites or team members are generating informal purchases. In most cases, maverick spending is concentrated around one or two sources. Address the process failure at the source rather than applying a blanket policy across all sites.
Vendor On-Time Delivery Rate below 60%
A vendor whose on-time delivery rate falls below 60% should not be assigned responsibility for critical-path materials during the next project phase. Share the performance data with the vendor in writing and set a minimum acceptable delivery rate as a condition for continuing preferred supplier status.
Material Utilization Rate below 85%
Compare the material issued for a particular activity with the daily progress recorded for the same period. If the reported consumption does not account for the quantity issued, the gap needs to be investigated. A material reconciliation should be completed before the next material request is approved.
Contract Compliance Rate below 90%
Before any payment is approved, the purchase order reference and agreed rate should be checked against every invoice. If an invoice contains a rate that differs from the agreed PO rate without an approved variation, it should not be processed for payment.
Construction management platforms such as Onsite connect material requests, purchase order issuance, vendor deliveries, and invoice approvals within one workflow. This means that On-Time Delivery Rate, Cycle Time, Rate Variance, and Maverick Spend can be measured using the system’s own data rather than tracked manually across spreadsheets and WhatsApp conversations.
The Procurement Report That Should Exist but Usually Does Not
Most projects have a monthly cost report. A construction company should also produce a monthly procurement performance report.
The cost report shows what has been spent on the project during the month. The procurement performance report shows whether that spending was controlled. It can reveal whether vendors delivered on time, whether purchase rates matched the agreed rates, whether there was excessive material wastage, and whether purchases followed the formal procurement process.
There is an important difference between these two documents. That gap is where many construction cost overruns begin.
The loss is rarely caused by one major mistake. More often, it is the result of hundreds of small procurement failures that were never measured. A minor delay, an unapproved rate revision, an informal purchase, or a small quantity discrepancy may seem recoverable on its own. But when these failures accumulate, they can create a cost overrun that becomes visible only in the monthly cost report.
The KPIs in this article are not intended to monitor the budget. They are the minimum set of measures that allow procurement to be actively managed rather than simply observed.
Frequently Asked Questions
What are construction procurement KPIs?
Construction procurement KPIs are measurable indicators that track how effectively a construction company’s purchasing function performs — covering vendor delivery reliability, purchase order processing speed, rate accuracy against estimates, off-process spending, material quality, utilization efficiency, payment timing, and contract rate compliance. Unlike financial KPIs that measure project outcomes after the fact, procurement KPIs are leading indicators that surface problems during execution while corrective action is still available. Most Indian construction companies track none of these formally, which means procurement failures only become visible when they have already produced cost overruns in the project P&L.
What is a good on-time delivery rate for construction material vendors in India?
An on-time delivery rate above 85 percent for a vendor supplying standard construction materials — cement, aggregate, steel — over a rolling three-month period represents acceptable performance. Below 70 percent signals a reliability problem that will affect site scheduling if that vendor is used for critical path activities. The more important number is the per-vendor breakdown rather than the site aggregate, because an aggregate rate can hide a specific vendor who is consistently late while others perform reliably. Any individual vendor consistently below 60 percent should not be allocated materials for activities where delivery timing directly affects the project schedule.
What is maverick spend in construction procurement and why does it matter?
Maverick spend is any material purchase made outside the formal purchase order process — verbal orders, WhatsApp approvals, cash purchases, or site-level buying without central procurement involvement. It matters because every maverick purchase bypasses three controls simultaneously: vendor comparison, rate check against the BOQ estimate, and budget approval before commitment. On Indian construction sites without a formal procurement system, maverick spend typically runs between 25 and 40 percent of total material spend. Reducing it does not require vendor renegotiation. It requires the procurement process to run consistently ahead of the site schedule so that formal POs exist before the material is needed.
How is rate variance calculated in a construction procurement context?
Rate variance in construction procurement is calculated as the difference between the actual purchase rate and the BOQ estimated rate for the same material, expressed as a percentage of the estimated rate. The formula is: (Actual purchase rate minus BOQ estimated rate) divided by BOQ estimated rate, multiplied by 100. A positive variance means the material was purchased at a higher rate than the estimate. A consistent positive variance above 5 percent for a major material category over multiple purchasing cycles indicates either that the original estimate was based on outdated rates or that purchases are being made without reference to the agreed rates — both of which require a different corrective action.
Why should vendor on-time delivery rate be tracked per vendor rather than as an aggregate?
An aggregate on-time delivery rate combines the performance of all vendors into one number that can make overall procurement appear acceptable while specific vendor relationships are creating serious schedule risk. A site with five vendors where four deliver on time 95 percent of the time and one delivers on time 30 percent of the time will show an aggregate rate of approximately 80 percent — which looks reasonable. The vendor performing at 30 percent is invisible in that aggregate. Tracking per vendor makes that vendor visible and allows the procurement team to remove them from critical path materials based on evidence rather than discovering the risk when a delivery fails at a critical point.
What is Days Payable Outstanding and why does it matter for construction contractors?
Days Payable Outstanding (DPO) is the average number of days a contractor takes to pay vendors after receiving materials, measured against the contracted payment terms. It matters because payment timing is a working capital lever that most Indian contractors do not actively manage. A vendor who will not reduce price may agree to extended payment terms — moving from 7-day to 30-day payment windows on the same material at the same rate. That extension creates 23 additional days of cash float that can fund site operations between billing cycles. DPO declining over consecutive months without a corresponding change in vendor agreements means the contractor is paying earlier than required and losing working capital that could be deployed elsewhere.
What is Contract Compliance Rate in construction procurement?
Contract Compliance Rate measures the percentage of procurement spend that is being executed at the rates formally agreed in purchase orders or vendor contracts, compared to total relevant spend. It is calculated as contracted-rate spend divided by total relevant spend, multiplied by 100. A rate below 90 percent means that more than 10 percent of spend is happening at rates that differ from what was formally documented and agreed. In Indian construction, Contract Compliance Rate is the KPI most likely to catch informal rate revisions — where vendors send revised rate letters citing cost escalation and the revised rate is accepted without checking whether the original PO or contract permitted such an adjustment.
