
Construction Cost Leakage: Where Project Margins Disappear
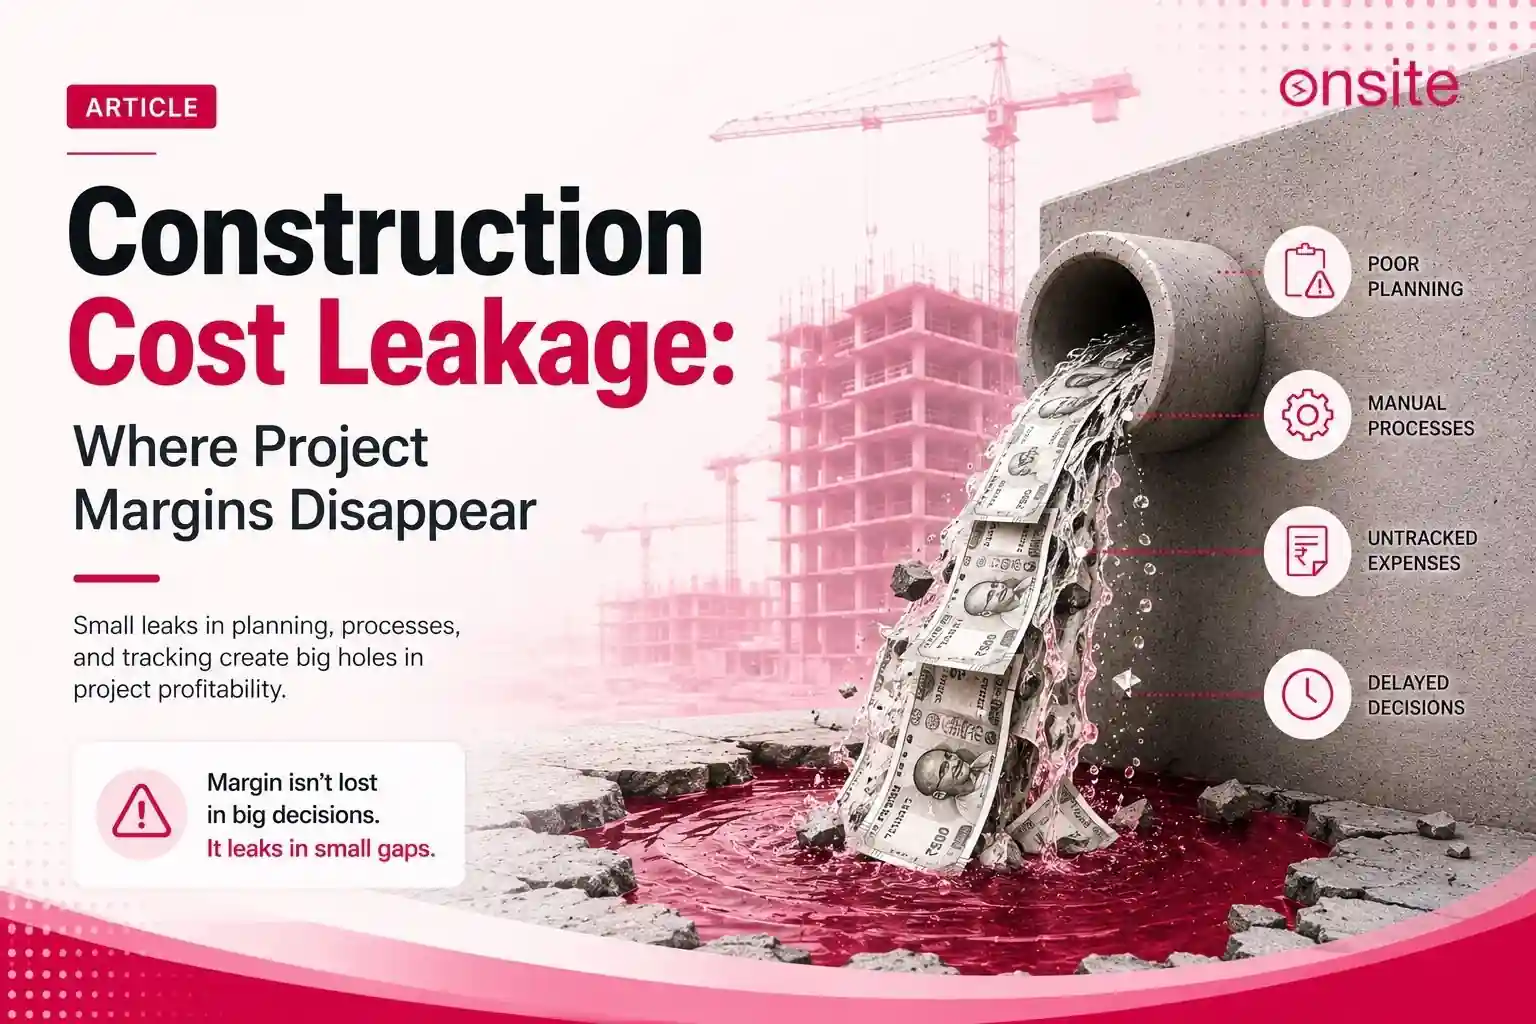
Construction cost leakage is the gradual loss of project margin through small and repetitive differences between what was planned and what was actually purchased, consumed, or paid during execution. It is different from a final budget overrun. A budget overrun usually becomes visible when costs have already exceeded the planned budget, often much later in the project. Cost leakage, on the other hand, happens quietly during execution.
It can result from material rate movements, excess consumption, labour productivity losses, equipment idle time, subcontractor cost risks, and scope changes. Individually, these differences may appear small and may not be immediately visible in a financial report. Over time, however, they can accumulate and reduce the project’s margin significantly.
What Causes Construction Cost Leakage?
Construction cost leakage is often caused by small issues across multiple cost categories. They initially seem manageable in isolation. However, collectively, they can become a reason for project loss. There are often cases where material purchase rates move above the BOQ rate. Consumption exceeds the planned quantity. Labour takes more days to complete the same output. Equipment sits idle. Subcontractor costs rise above the agreed scope, and additions to the scope are executed before their cost is formalized. Each deviation may look manageable on its own, but together, they can produce a final cost overrun.
A Project Rarely Loses Its Margin in One Big Decision
Even a cost leakage of 1% on a ₹10 crore project can result in a loss of ₹10 lakh. On the same project, a 3% leakage can cost ₹30 lakh. Neither of these losses usually results from a single wrong decision. They are often the result of dozens of small mistakes or deviations, such as a material rate that is 2% above the BOQ estimate, a plastering gang operating at 80% of planned productivity for six weeks, and so on.
None of these problems comes with an individual warning or appears as a crisis on its own. But together, they become the reason for a cost overrun.
Industry Context
PwC’s 2025 Capital Projects and Infrastructure Survey found that 81% of respondents experienced project cost overruns in the preceding year, with 62% of those identifying higher material, labour, and equipment costs as a leading cause. The real question for contractors is whether cost leakage is detected while correction is still possible or discovered after the margin has already been lost.
The final overrun is visible. The leakage that created it usually is not.
The Difference Between Cost Leakage and a Cost Overrun
A cost overrun is something that usually shows up by the end of the project. However, cost leakage is one of the reasons why the cost overrun takes place. Cost leakage is the accumulation of small, recurring deviations from the planned cost position. It may happen during a specific week, on a specific activity, or within a specific cost category.
It is usually not visible right away. It slowly consumes the budget and eventually affects the overall construction project cost.
The majority of construction companies manage cost after the overrun has already taken place. Meanwhile, cost leakages occur throughout the project, and that is when cost management should be put into action.
Where Construction Cost Leakage Usually Starts
Material Rates Move Above the Expected Rate
The cost slips away when the rates assumed in the BOQ are exceeded by the rates at which materials are actually purchased. For example, steel may be purchased at a rate five percent above the BOQ assumption across all reinforcement deliveries. It is necessary to compare each PO rate against the BOQ and project budget assumptions. Any purchase made above the assumed rate creates a loss for the project and should be considered a form of cost leakage.
Material Consumption Is Higher Than Expected
When material consumption exceeds the planned quantity, it leads to material overconsumption. A material consumption ratio of 1.15 compared with a BOQ assumption of 1.05 compounds the loss across every floor. It is necessary to check material receipts and consumption against the work executed on the same project and identify the reason behind the material overconsumption.
Labour Takes More Days for the Same Output
When a trade takes more days to produce a defined quantity than the BOQ has assumed, the daily labour cost is spread across a smaller output. A plastering team may cost 25% more per square metre than it was originally rated in the BOQ. Comparing the labour cost of each period against the quantity of work completed and arriving at the cost per unit of output indicates a productivity problem that requires investigation at the site level.
Equipment Remains Idle While Cost Continues
When equipment is not producing any output, the rental cost still continues. For example, there might be an excavator at a construction site on a thirty-day hire, but it may be used for only fifteen days. The rest of the time, it is sitting idle, and the company is effectively paying twice the rate for the productive days. These things need to be planned smartly. You need to compare equipment deployment records against the hire cost for the same period. A deployment report should exist.
Subcontractor Costs Drift
Subcontractor billing reviewed only at the invoice stage means the issue may be noticed after the entitlement has already arisen. Compare the cumulative subcontractor billings against the contracted value each time a bill is presented. When the cumulative total approaches the contracted value before the scope is complete, through quantity increases, unvalued variation instructions, or invoiced scope beyond the agreement, the reason needs to be formally investigated before the next payment.
Cost Per Unit Can Reveal Leakage Earlier Than Total Project Cost
When you compare total budget spending with the total budget, it can hide the composition of cost performance. Overall, a project can be under budget while producing every unit of work at a higher cost than planned. This can indicate that the remaining budget will be insufficient to complete the remaining scope. Cost per unit analysis helps compare the actual cost of producing a defined unit of output against the planned cost for the same output, rather than comparing the total budget. The comparison and unit will vary by activity type.
Cost per cubic metre of concrete placed comparing actual concrete, formwork, labour, and equipment cost per m³ against the BOQ assumption
Cost per tonne of reinforcement steel fixed comparing actual steel, labour, and bending cost per tonne against the BOQ rate
Labour cost per square metre of plastering comparing actual daily labour deployment against daily plastered area
Subcontractor cost per square metre of flooring comparing RA bills against measured floor area completed.
If cost per unit is rising continuously across several production cycles, there is cost leakage at the activity level, even if the total budget position looks fine. There might be times when a project has spent 40% of its budget while completing 40% of its scope, making it look like the project is performing well. However, if the cost per unit of work completed is 15% above plan, and the remaining 60% of the scope will cost significantly more than the remaining 60% of the budget, then it is a problem.
A Project Can Be Within Budget and Still Be Losing Money
One of the major mistakes and sources of delayed response to cost leakage is that contractors assume that if the project overall is within budget, then it is financially healthy. But the picture is larger than it seems. A project may be showing a favourable overall budget position while cost leakages are taking place. These can come as a surprise by the end of the project if they are not scrutinised sooner.
| Cost Area | Looks Fine at First | Early Leakage Signal |
|---|---|---|
| Materials | Within total budget | Purchase rate rising above BOQ |
| Labour | Within budget | Cost per unit of output increasing |
| Equipment | Within budget | Idle hours increasing as proportion of total hours |
| Subcontractor | Within budget | Quantity or scope creeping above contracted position |
Each warning sign can be visible even before the total budget reflects it.
Five Metrics That Can Reveal Construction Cost Leakage
1. Cost Per Unit Variance
Cost per unit variance helps measure the difference between the actual cost of producing 1 defined unit of output and the planned cost of the same unit as established in the BOQ. It helps surface a problem before it is too late and before it shows up at the end of the project when the budget position reflects it.
If the cost per unit is rising in a single activity, it means that there is a site-specific problem. However, if there is a rising cost per unit across multiple activities, it indicates that there is a problem in the system, which basically means a systematic issue with declining productivity or procurement costs consistently above the BOQ rates.
2. Material Rate Variance
Material rate variance helps in measuring the difference between the rate at which material is purchased and the rate that was decided in the BOQ. Material rate variance is one of the major signals helping in controlling cost leakages. Procurement decisions determine how much of any market movement the project absorbs. If there is a consistent increase in the purchased material rate above the BOQ rate, it may reflect a genuine market movement, a supplier substitution made without cost comparison, or a purchasing decision made without reference to the BOQ rate.
3. Material Consumption Variance
Material consumption variance is basically the difference between the material that is actually being consumed for the given scope and the material that was assumed to be consumed in the BOQ. Knowing the difference between them helps in comparing material receipts against the executed work quantities. These 2 reports are typically maintained separately. Meanwhile, they need to be compared. It helps in finding genuine material wastage, a BOQ measurement error, or an uncontrolled material issue when material leaves the site without being matched to specific work.
4. Labour Cost Per Unit of Output
Labor cost per unit of output helps in measuring the total labor cost, including wages, contractor charges, and overtime, attributable to a defined unit of completed work in a period. It matters because labor is majorly least likely to be monitored at the unit level and is most likely to carry sustained leakage. A group may be taking more time to complete a scope as compared to the time it was planned. Measuring labor cost per unit of output helps in realizing the rising labor cost per unit, which may reflect productivity loss from many activities like crew composition, rework, or material waiting, overtime without output improvement, or attendance recorded without distinguishing productivity from idle hours.
5. Committed Cost Against Remaining Budget
Total commitment cost may consist of purchase orders, subcontractor packages, and material on-site, and measuring them against the remaining unspent budget may help in saving the project from overrun. A project might have committed 90% of its budget while completing 70% of its scope. This is a problem that will not appear in spending records until the invoices arrive. When the committed cost is reaching the remaining budget before the scope is even completed, the project is definitely going to face an overrun when the project is completed.
What Should Happen When a Cost Signal Moves
When a cost signal changes from its baseline, the first response is a specific question about the cause, not an entry in a variance log.
| Early Signal | First Question |
|---|---|
| Material rate increases | Is this market movement, a supplier change, or a purchasing decision made without reference to the BOQ rate? |
| Material consumption increases | Is the quantity consumed justified by the work executed in the same period? |
| Labour cost per unit rises | Has crew productivity changed, or has overtime been applied without proportional output? |
| Equipment cost rises | Is equipment being deployed productively, or has idle time increased? |
| Subcontractor cost increases | Has the scope or quantity changed, and has the change been formally valued? |
After asking these questions, whatever answer comes out will determine the corrective actions. A market-driven material rate increase may require a budget revision and a review of procurement options. And if it is a productivity-driven labor cost increase, it requires a site investigation. You cannot find a solution unless the right question is being asked.
The 3% Problem: Small Leakage Can Become a Large Loss
Let’s take an example of a ₹10 crore project. In this project, consider 4 simultaneous deviations, each modest in isolation.
Material rates in this project are 2% above the BOQ-decided rate. The BOQ decided that the material spend would be ₹3 crore. If there is a 2% rise in the spend, which means there is ₹6 lakh that has been overspent.
The material consumption is 5% above the planned quantities across the same ₹3 crore material spend, which means a loss of ₹15 lakh.
The labor productivity is running at 85% of plan across a labor cost of ₹2 crore, producing a labor cost per unit 15% above the BOQ, which is ₹30 lakh.
A subcontractor quantity is 5% above the contracted amount across a subcontractor spend of ₹2 crore, which means ₹10 lakh.
In this calculation, the total leakage across just these 4 cost heads is ₹61 lakh, or 6.1% of the project cost.
None of these problems are extreme. For material, it’s just a 2% rise from the decided price, and it may seem acceptable. An 85% productivity factor is not unusual for a mixed-skill site group. A 5% quantity excess in subcontractor work can arise from a single unmeasured scope addition. But together, they consumed more than 6% of a project that appeared controlled throughout the process of execution.
These percentages are not industry standards. They are illustrative. But the point here is that, in total, the cost leakage took place for more than 6% of the total project cost, which is one of the huge losses in a construction project. And these are just 4 costs. There are multiple other things that take place at a construction site that can lead to cost leakages.
How to Investigate Construction Cost Leakage Before It Becomes an Overrun
When there are problems with cost leakage, there is a total of 8-question framework that helps in investigation and leads to corrective actions.
What changed? You need to define the specific deviation, not just say, “labor costs are up,” but say, “labor costs per square meter of plastering are 18% above the BOQ for the past 3 weeks.” It gives more clarity than just saying labor costs are up.
Where did the deviation begin? You need to identify the time at which the signal first moved above the baseline. Every time you’re identifying the beginning of a deviation, there is more scope for you to correct things.
Is it recurring? A single period of deviation can be ignored, but a recurring deviation indicates a structural problem rather than just an event.
Is the cause operational, commercial, or market-related? You need to find the cause. Operational causes, like productivity, crew consumption, and rework, can be addressed by site management. Commercial causes, like purchase rates and subcontractor billing, can be addressed by procurement and commercial teams. Market causes may require a budget revision.
How much work remains? A rate variance on a material with 90% of its quantities still to be purchased is more significant than the same variance with 10% remaining. The remaining scope determines the financial significance of the current deviation.
What will happen if nothing changes? You need to calculate the cost to complete at the current deviation rate and compare it against the budget that is still remaining to be spent. This difference pushes you towards the corrective action.
Who needs to act? You need to assign corrective action to specific people who are best positioned to address the specific cause: procurement for rate issues, the project manager for productivity, and the site engineer for consumption.
By when? Set a required resolution date that is early enough to limit further accumulation of the leakage before the corrective action takes effect.
These problems may never occur if the contractor has a systematic way of handling everything. Construction budgeting software helps in connecting purchase orders, GRNs, and daily progress reports to the BOQ, which helps in investigating cost leakages and preventing them.
Construction Cost Leakage Prevention Checklist
The following checklist covers the monitoring actions that, applied regularly, give a project team the earliest possible visibility into developing cost leakage.
☐ Review cost per unit for each active cost category and compare against the BOQ assumption
☐ Check material purchase rates against BOQ rates for all active procurement
☐ Compare material consumption in the period against the quantity of work executed in the same period
☐ Review labour cost per unit of output for each active trade and compare against the planned rate
☐ Check equipment utilisation, proportion of hired or deployed equipment hours used productively versus idle
☐ Review subcontractor cumulative billing against contracted value and check for unvalued scope additions
☐ Check committed cost against remaining budget to identify any category approaching or exceeding its budget before the scope is complete
☐ Review all scope changes executed in the period and confirm each has a formal variation order with an estimated cost
☐ Identify any deviations that have persisted across more than one measurement period and assign a named investigation
☐ Confirm a named responsible person and a corrective action with a required completion date for every open deviation
Conclusion
Construction cost leakages come in the form of cost overruns, majorly by the end of the project. But cost leakages take place way earlier than they are realized by project managers or contractors. They come with small differences between what was planned and what actually happens on the site. Scrutinizing these differences and finding them at early stages gives the project team time to correct the cost and protect the remaining margin.
The tools for early detection are not sophisticated: cost per unit comparison, material rate checking, consumption reconciliation against executed work, and labour cost per output measurement. What they require is structured, regular comparison, weekly rather than monthly, at the activity level rather than the project total.
FAQs
What is construction cost leakage
Construction cost leakage is the loss of project margin through small, repeated differences between planned and actual costs during construction execution. It differs from a final budget overrun in that it occurs and accumulates during the project rather than appearing at the end. Material purchase rates above BOQ, excess consumption, labour productivity below planned levels, equipment idle time, subcontractor cost drift, and scope additions not captured in the financial record are the most common sources. Each deviation is typically small. Accumulated across multiple cost categories and several months of execution, they produce the overrun that appears at project close.
What causes construction cost leakage
Construction cost leakage is caused by small deviations in material rates, material consumption, labour productivity, equipment utilisation, subcontractor billing, and scope management. Material rates above the BOQ estimate apply to every subsequent purchase. Consumption above planned quantities compounds across every delivery. Labour productivity below the planned rate produces a rising cost per unit of output that accumulates daily. Equipment idle time generates hire cost without corresponding output. Subcontractor scope additions create financial commitments before they are formally valued. Each cause is independently manageable if identified early. Together, they produce cost leakage that only becomes visible as a formal overrun late in the project.
How is cost leakage different from a cost overrun
A cost overrun is the financial result visible when a project closes — the difference between what was budgeted and what was actually spent. Construction cost leakage is the accumulation of small deviations during execution that produces the overrun. The distinction matters operationally: cost leakage can be detected and partially corrected during execution, while a cost overrun can only be measured after execution is complete. Most construction cost management processes are designed to measure the overrun accurately. Construction cost leakage management requires monitoring specific cost signals at the activity level during execution, while time remains to investigate and correct the cause.
How can contractors identify cost leakage early
Contractors identify cost leakage early by monitoring cost per unit of output rather than only total spending. Comparing the actual cost of a defined unit of production — cost per cubic metre of concrete, cost per square metre of plastering, labour cost per tonne of steel fixed — against the BOQ assumption for the same unit reveals deviations at the activity level before they accumulate into a total budget impact. Material purchase rates compared against BOQ rates at the point of purchase order, consumption records compared against executed quantities, and subcontractor billings compared against contracted scope are the three most practical regular checks.
Why is cost per unit useful in construction
Cost per unit converts two records that are typically maintained separately — what was spent and what was produced — into a single comparable figure. A project team that knows it spent Rs 45 lakh on plastering this month and knows the gang plastered 3,000 square metres can calculate that plastering cost Rs 1,500 per square metre. If the BOQ assumed Rs 1,250 per square metre, the team has a specific, actionable signal — twenty percent above plan — rather than a general observation that plastering costs are high. This specificity makes investigation possible and makes the financial consequence of the deviation concrete.
Can a project be within budget and still lose money
Yes. Total budget position is a lagging indicator aggregating across all cost categories. Individual cost drivers can move against the plan without immediately affecting the total position, because financial impact accumulates over time. Material rates above BOQ will only produce an overrun once sufficient quantity has been purchased at the higher rate. Labour cost per unit above plan will only produce an overrun once sufficient weeks of below-plan productivity have accumulated. A project appearing within budget at mid-point may already have cost drivers moving toward a final overrun that is mathematically inevitable at the current rate.
How does material consumption cause cost leakage
Material consumption causes cost leakage when the quantity used to complete a given scope exceeds the BOQ estimate for the same work. The excess is not visible in purchase records alone — it becomes visible only when consumption is compared against executed work quantity in the same period. A concrete consumption ratio of 1.15 cubic metres per cubic metre of slab, against a BOQ assumption of 1.05, produces a ten percent excess on every pour. Across a multi-floor structure, this compounds into a significant material overrun — undetectable without tracking both material received and work executed in the same cycle.
How does labour productivity affect construction cost
Labour productivity affects construction cost through its direct effect on cost per unit of output. When a crew takes more working days to complete a given quantity than the BOQ assumed, the daily labour cost is spread across a smaller output. The result is a labour cost per unit higher than planned — meaning the remaining scope will cost more than the remaining labour budget allows. Productivity below plan does not appear as a budget overrun immediately. It appears as rising labour cost per unit — requiring measurement of both attendance cost and production quantity in the same period, compared against the BOQ assumption.
How can contractors prevent small cost deviations from becoming major losses
Contractors prevent small cost deviations from becoming major losses by monitoring cost signals at the activity level and investigating them before they compound. The specific actions are: comparing material purchase rates against BOQ rates at procurement, comparing material consumption against executed quantities weekly, calculating labour cost per unit and comparing against the BOQ assumption, checking equipment utilisation ratios for idle time, reviewing subcontractor billing against contracted scope at each billing cycle, and confirming all scope changes have a formal cost estimate before execution. Applied consistently, these checks close the window between when leakage begins and when it becomes too large to correct.
