
How to Use Progress & Task Reports in Onsite
Before You Start
- Tasks must be created in the project’s Task tab before task reports show data
- Progress must be updated by the site team before progress-based columns show figures
- Inspection forms must be completed before the Site Inspection Report shows entries
- You need a role with Download Reports permission to access these reports
How to Open Progress and Task Reports
- Click Reports in the left sidebar
- Scroll to the Progress and Task section
- Click the gear icon next to the report you want to open with full filters
- Click the download icon to download directly with default settings
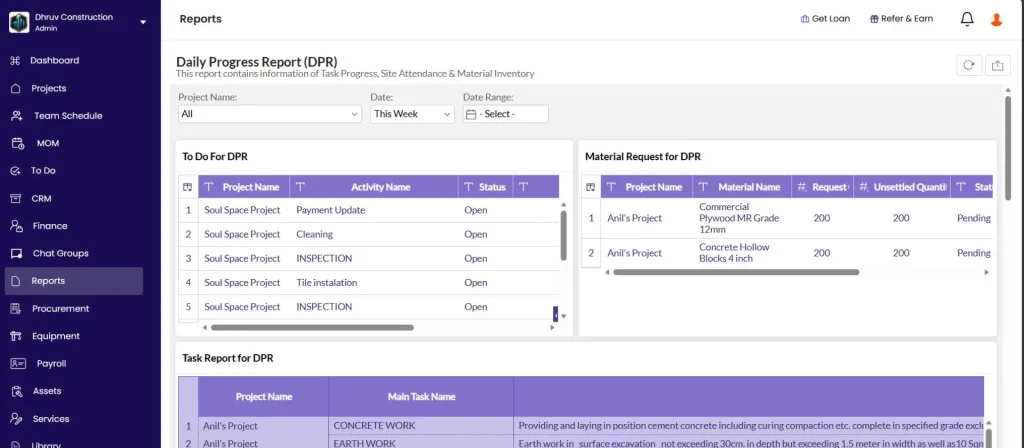
Report 1 — Daily Progress Report (DPR)
The DPR is an auto-generated PDF summarising all site activity for a selected date or date range. It is compiled automatically from data already entered in the app — attendance marked, materials received and used, equipment entries, subcontractor progress, task progress, and site photos uploaded. You do not fill it manually.
Sections included in the DPR
| Section | What It Shows |
|---|---|
| Work Summary | Tasks updated for the period with progress percentage and remarks |
| Labour Report | Workers present, shifts, and overtime hours |
| Material Inventory | Opening stock, received, used, and closing stock |
| Material Requests | Pending and fulfilled material requests |
| Equipment | Equipment usage and fuel added |
| Subcon Progress Summary | Subcontractor work order progress updates |
| Site Photos | Photos uploaded with GPS coordinates and timestamps |
| AI Insights | AI-generated high, medium, and low priority flags for the site |
How to generate the DPR — Mobile
From any project (quick download): Tap the DPR quick action button on the home screen. Select the project and date. Tap Download DPR.
From inside a project, Task tab: Open the project. Go to the Task tab. Tap the PDF icon at the top right. The DPR for today downloads immediately.
From inside a project, Site tab (with section control): Open the project. Go to the Site tab. Navigate to the date using the arrows. Scroll down and tap Create DPR. Uncheck any sections you do not need. Tap the download or share button.
How to generate the DPR — Desktop (web)
- Open the project and go to the Task tab
- Click the Download button at the top right
- Click DPR from the dropdown
- A Download Options panel opens on the right
- Set the date range: Today, Last Week, Last Month, This Week, or Custom
- For Custom: select start and end dates and click Apply
- Tick or untick sections to include or exclude
- Click Download
Sharing the DPR
Once downloaded, the PDF can be shared directly via WhatsApp, email, or any other sharing option from your phone or browser.
Report 2 — Task Report
Shows task-wise progress across all projects with status and delay tracking.
Filters:
| Filter | What It Does |
|---|---|
| Project Name | Filter to one project or show all |
| Main Task Name | Filter by top-level task group |
| Group Task Name | Filter by sub-group |
| Task Name | Filter by a specific task |
| Progress Date | Show progress updates for a specific date range |
| Task Status | Not Started, Ongoing, On Hold, Needs Revision, Cancelled, Completed |
| Delay Status | On Track or Delayed |
| Assigned To | Show tasks assigned to a specific team member |
| Start Date | Filter by task start date |
Columns:
| Column | What It Shows |
|---|---|
| Project Name | Project the task belongs to |
| Main Task | Top-level task group name |
| Group Task Name | Sub-group name |
| Task Name | Individual task name |
| Assigned To | Team member responsible |
| Task Status | Current status (Ongoing, Completed, etc.) |
| Delay Status | On Track or Delayed (based on planned vs actual end date) |
| Start Date | Task start date |
| End Date | Task end date |
| Unit | Unit of measurement |
| Estimated Qty | Total planned quantity |
| Opening Qty | Quantity at the start of the filtered period |
| Progress Qty | Quantity completed during the filtered period |
| Closing Qty | Quantity at the end of the filtered period |
| % Complete Task | Overall completion percentage |
| Last Progress Date | Most recent progress entry date |
Best used for: Finding all delayed tasks across projects at once, or reviewing overall task completion percentages for a management summary.
Report 3 — Task Measurement Book
Shows measurement-level progress entries for tasks, with full length, width, and height breakdowns for each entry.
Filters: Project Name, Main Task Name, Group Task Name, Task Name, Progress Date, Task Status.
Columns:
| Column | What It Shows |
|---|---|
| Project Name | Project the task is in |
| Main Task Name | Top-level task group |
| Group Task Name | Sub-group |
| Task Name | Task name |
| Progress Date | Date the entry was recorded |
| Unit | Unit of measurement |
| Estimated Quantity | Total planned quantity for the task |
| Opening Quantity | Quantity before this entry |
| Number | Count dimension entered during progress update |
| Length | Length dimension |
| Width | Width dimension |
| Height | Height dimension |
| Progress Quantity | Calculated as Number x Length x Width x Height |
| Closing Quantity | Running total after this entry |
| Progress Notes | Any notes added at the time of the progress update |
Best used for: Auditing individual measurement entries for a task, or verifying site measurements against drawings when a quantity is disputed.
Report 4 — Task Material Report
Shows all materials consumed against tasks across projects.
Filters: Project Name, Material Name, Main Task Name, Group Task Name, Task Name, Used Date.
Columns:
| Column | What It Shows |
|---|---|
| Project Name | Project the task is in |
| Material Name | Name of the material used |
| Main Task Name | Top-level task group |
| Group Task Name | Sub-group |
| Task Name | Task the material was used against |
| Qty Used | Total quantity consumed |
| Avg Unit Rate | Average rate per unit across all material usage entries |
| Avg Cost | Average total cost calculated from qty and rate |
Best used for: Reviewing material consumption per task, or cross-checking material usage against the task resource budget.
Report 5 — To Do Report
Shows all To Do items across projects with status, assignment, and due date details.
Filters: Project Name, Activity Name, Assigned To, Due Date, Status, Related Task, Creator Name.
Columns:
| Column | What It Shows |
|---|---|
| Activity Name | Title of the To Do item |
| Project Name | Project it belongs to |
| Status | Pending or Completed |
| Creation Date | When the To Do was created |
| Due Date | Target completion date |
| Last Updated Date | Most recent update |
| Assigned To | Person responsible |
| Type | To Do type (Snag, Design Issue, Maintenance, etc.) |
| Related Task | Task linked to this To Do (if any) |
| Creator Name | Who created the To Do |
| Closed Date | When it was marked complete |
Best used for: Weekly reviews of all pending To Dos across projects, or tracking snag list closure during the finishing stage of a project.
Report 6 — Task Resource Budget vs Actual Report
Compares planned resource budgets against actual usage for materials, workforce, and equipment per task. Rows where actual usage exceeds the budget are highlighted in red.
Filters: Project Name, Main Task Name, Group Task Name, Resource Name, Resource Type.
Columns:
| Column | What It Shows |
|---|---|
| Project Name | Project the task is in |
| Main Task Name | Top-level task group |
| Group Task Name | Sub-group |
| Task Name | Task name |
| Task Unit | Unit of measurement for the task |
| Task Qty | Estimated quantity for the task |
| Task Progress Qty | Quantity completed to date |
| Resource Name | Name of the material, workforce type, or equipment |
| Resource Type | Material, Labour, or Equipment |
| Budgeted Rate | Rate per unit set in the resource budget |
| Avg Unit Cost | Average actual cost per unit from recorded entries |
| Unit | Resource unit |
| Qty per Unit Progress | Resource quantity budgeted per unit of task progress |
| Budgeted Qty | Total resource quantity budgeted for the full task |
| Pro Rata Budget Qty | Budgeted quantity scaled to current task progress (Budgeted Qty x Task Progress Percentage) |
| Actual Used Qty | Resource quantity actually consumed to date |
| Budgeted Amount | Total budgeted cost for this resource on this task |
| Pro Rata Budget Amount | Budgeted amount scaled to current task progress |
| Actual Amount | Actual cost recorded from usage entries |
| Exceeded Qty | Actual Used Qty minus Pro Rata Budget Qty (shown in red when positive) |
| Exceeded Amount | Actual Amount minus Pro Rata Budget Amount (shown in red when positive) |
💡 Pro Rata Budget columns adjust the budget to match the current progress level. For example, if a task is 60% complete, the Pro Rata Budget Qty shows 60% of the full budget. This makes the actual vs budget comparison fair — comparing actual consumption against the full budget on a half-finished task would always show a surplus.
Best used for: Identifying which tasks are over-consuming resources relative to their current progress, catching material or labour overruns before they compound further.
Report 7 — Site Inspection Report
Shows all site inspections across projects with pass or fail status and item-level details.
Filters:
| Filter | Options |
|---|---|
| Project Name | Filter to one project or show all |
| Inspection Date | Set a date range |
| Inspection Name | Filter by a specific inspection form |
| Inspection Status | Pass or Fail |
| Approval Status | Approved or Pending |
Columns:
| Column | What It Shows |
|---|---|
| Project Name | Project the inspection was run on |
| Inspection Date | Date the inspection was conducted |
| Inspection Name | Name of the inspection form used |
| Inspection Status | Pass or Fail |
| Inspection Items | Items checked in the inspection |
| Inspection Notes | Notes recorded during the inspection |
| Created Date | When the inspection record was created |
| Approval Status | Whether the inspection was subsequently approved |
Best used for: Reviewing all failed inspections across projects for follow-up, or generating a quality compliance summary for a client or auditor.
Tips
- Use Task Report with Delay Status set to Delayed to instantly see all overdue tasks across the company without opening individual projects.
- Use Task Measurement Book when a site quantity is disputed. The Number, Length, Width, and Height columns show exactly how each measurement was recorded, making verification straightforward.
- Use Task Resource Budget vs Actual weekly to catch overruns early. The Exceeded Qty and Exceeded Amount columns, highlighted in red, make over-budget tasks immediately visible.
- The Pro Rata Budget columns in the Resource Budget report are the correct comparison point — not the full Budgeted Qty. Comparing actual consumption against the full budget on a half-finished task always makes the task look under budget, which is misleading.
- Use Site Inspection Report with Inspection Status set to Fail and no date filter to get a full list of all unresolved failed inspections across the company.
- Use To Do Report with Status set to Pending and filter by Assigned To to prepare a personal action list for each team member during a weekly review.
- The DPR is the most shareable document from this section. Generate it daily or weekly and share it with clients or management directly from the app.
If Something Goes Wrong
| Problem | Likely Cause | What to Do |
|---|---|---|
| Task Report shows no data | No tasks created or no progress recorded | Create tasks in the Task tab and ensure the site team has been updating progress |
| DPR shows blank sections | No data recorded for those sections on the selected date | Verify that attendance, materials, and equipment were entered for that date |
| Measurement Book shows no entries | Progress updates recorded without dimensions | Ask the site team to update progress using the Number, Length, and Width fields |
| Resource Budget report showing no exceeded rows | No resource budgets set on tasks | Go to the Task tab, open each task’s Resources tab, and set Budget Qty for materials, labour, and equipment |
| Site Inspection Report showing no entries | No inspections completed | Complete inspections from the Task detail panel in the project first |
| Cannot access the reports | Role does not have Download Reports permission | Ask Admin to enable Download Reports on your role in Settings, then Roles and Access |
| DPR PDF download failing | Large date range selected | Reduce the date range to 7 days or fewer for large projects with many photos |