
How to Use the Project Dashboard
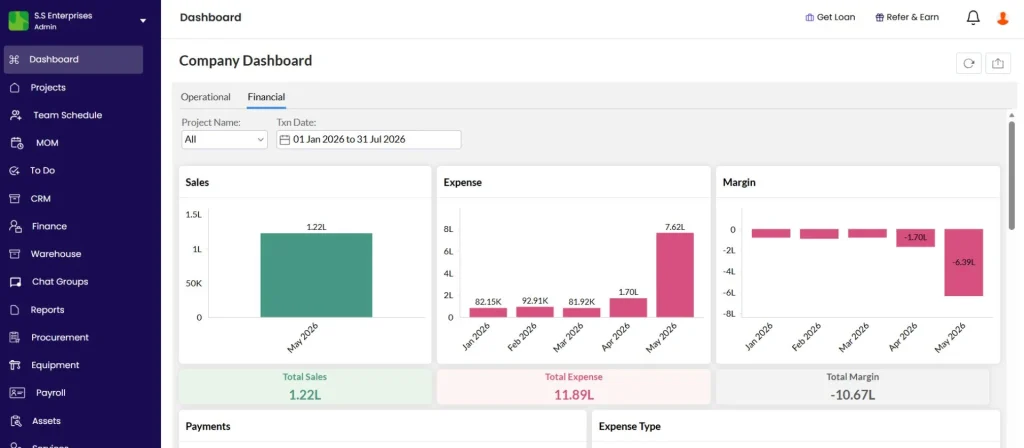
The Project Dashboard gives a complete overview of a project in two views — Financial and Operational. Financial shows budget, costs, and billing gaps. Operational shows project status, key personnel, schedule, and progress charts.
Before You Start
- You must be inside a project
Opening the Dashboard
Click Dashboard from the project tabs. The dashboard opens in Financial view by default.
Financial Dashboard
Budget
Shows the total project budget and breakdown by cost code.
Click View Breakup next to Budget to open the budget panel.
| Field | What It Shows |
|---|---|
| Total Budget | Total available project funds across all cost codes |
| Per cost code rows | Each cost code with its allocated budget amount |
To add a cost code:
- Click + Add Cost Code
- Check the box next to the cost code you want to add
- Click Save
To edit a budget amount:
Double-click the amount field next to the cost code, type the new amount, and it saves automatically.
Payables
Shows total amount outstanding to vendors.
Click Payables to open the breakup of outstanding amounts by party.
BOQ vs Work Done vs Invoiced
Shows the gap between what has been completed and what has been billed.
| Metric | What It Shows |
|---|---|
| Work Done | Total value of work completed on site (based on task progress) |
| Invoiced | Total value billed to the client so far |
| Gap | Work Done minus Invoiced — unbilled revenue |
Use this section to identify how much revenue can still be raised as invoices before the project closes.
Expense Breakup
Bar chart showing expenses over time, broken down by category: Material, Expense, Salary, Debit Note.
Operational Dashboard
Click Operational at the top of the dashboard to switch to the operational view.
Project Status
| Field | What It Shows |
|---|---|
| Status | Current project status (Ongoing, On Hold, Completed) |
| Overall Progress | Project completion percentage (e.g. 75%) |
| Project Value | Total contract value |
Key Personnel
Lists the staff assigned to the project with name, phone number, and role (e.g. Site Engineer, Admin).
To update: click the edit icon, check or uncheck personnel, and click Save.
Planned vs Actual Dates
| Type | Fields |
|---|---|
| Planned | Planned start date, planned end date, days remaining |
| Actual | Actual start date, revised end date |
Month-on-Month Progress Chart
Visual chart showing project progress over time.
- Click Zoom Out to see the full project timeline
- Click Download SVG, Download PNG, or Download CSV to export the chart
Contractor Summary
Summary of subcontractor work order progress on the project.
Tips
- Switch between Financial and Operational using the tabs at the top of the dashboard.
- The BOQ vs Work Done gap shows exactly how much revenue can still be invoiced. Monitor this regularly toward project completion.
- Cost codes help track budget against different work categories (Civil, Electrical, Plumbing, Finishing). Add all cost codes before recording expenses so the budget breakup is accurate from the start.
- The Month-on-Month Progress chart can be downloaded as an image or CSV for sharing in management reports or client presentations.
- Budget Remaining goes negative when expenses exceed Project Value — flag this to the project manager immediately.
If Something Goes Wrong
| Problem | Likely Cause | What to Do |
|---|---|---|
| Budget showing zero | No cost codes added | Click View Breakup and add cost codes |
| Key Personnel section is empty | No staff assigned to the project | Click the edit icon in Key Personnel and assign team members |
| Work Done shows zero | No task progress updated | Update task progress in the project’s Task tab |
| BOQ vs Invoiced gap is very large | Invoicing is behind work completion | Review outstanding unbilled items and raise invoices |
| Progress chart shows no trend | No task progress entries exist | Ensure the site team is updating task progress regularly |