
How to Use the Company Dashboard in Onsite
How to read the Company Dashboard — project status overview, sales and expense graphs, payment summary, expense type breakdown, and the project-wise summary table.
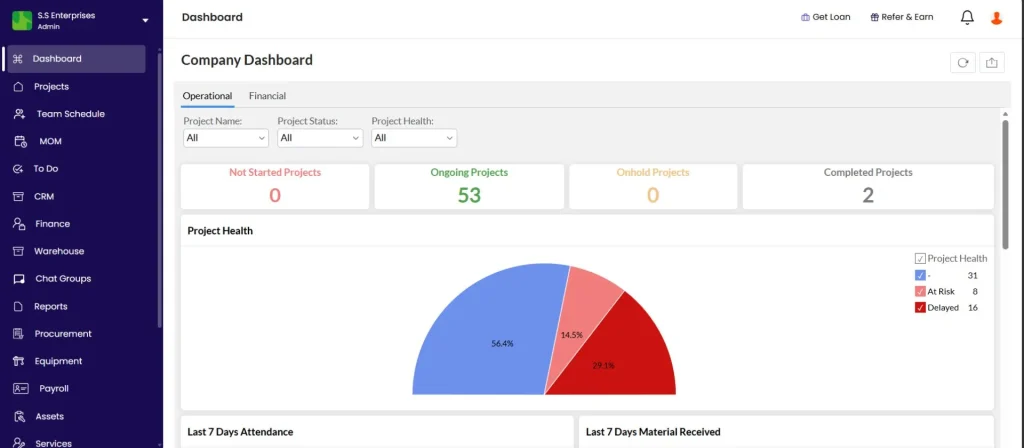
Accessing the Dashboard
Click Dashboard in the left sidebar. This is the company-level view showing data across all projects.
Filters
At the top of Company Analytics:
| Filter | What It Does |
|---|---|
| Project Name | Filter all charts and tables to a specific project (default: All projects) |
| Date | Set the date range for all data (default: last 6 months) |
Project Status Summary
Three cards at the top show a live count of projects by status:
| Card | What It Shows |
|---|---|
| Not Started Projects | Projects with status Not Started |
| On Hold Projects | Projects currently paused |
| Ongoing Projects | Projects actively in progress |
Sales, Expense, and Margin Graphs
Three charts showing monthly trends:
| Chart | What It Shows |
|---|---|
| Sales | Monthly sales invoices raised to clients — bar chart by month |
| Expense | Monthly expenses across all projects — bar chart by month |
| Margin Graph | Monthly margin (Sales minus Expense) |
Below the charts:
| Metric | What It Shows |
|---|---|
| Total Sales | Sum of all sales in the selected date range |
| Total Expense | Sum of all expenses in the selected date range |
| Total Margin | Total Sales minus Total Expense |
Payments Section
Shows cash flow across the selected period:
| Metric | What It Shows |
|---|---|
| Payment In | Total payments received from clients |
| Payment Out | Total payments made to vendors and parties |
| Cash Balance | Payment In minus Payment Out |
The Payments graph shows monthly Payment In and Payment Out as a bar chart.
The Expense Type donut chart breaks total expenses down by category: Debit Note, Material Expense, Other Expense, Salary Expense, Site Expense, and additional categories.
Project-wise Summary
Scroll below the graphs to reach the Project-wise Summary.
Status filter options: Ongoing, Not Started, On Hold, Completed.
Summary cards across all filtered projects:
| Card | What It Shows |
|---|---|
| Advance Paid | Total advances paid out to vendors and subcontractors |
| To Pay | Total outstanding amount to be paid |
| To Receive | Total outstanding amount to be received from clients |
| Advance Received | Total advances received from clients |
A pie chart visualises the proportion of To Pay, To Receive, Advance Paid, and Advance Received.
Project table — one row per project:
| Column | What It Shows |
|---|---|
| S.No | Serial number |
| Project Name | Name of the project |
| City | Project location |
| Start Date / End Date | Project dates |
| Progress | Task completion percentage |
| Project Value | Total contract value |
| Budget Remaining | Project Value minus Total Expense |
| Total Expense | All expenses charged to this project |
| Total Sales | All sales invoices raised on this project |
Tips
- Change the date range to compare different periods (e.g. this financial year vs last financial year).
- Filter by Project to see analytics for a single project across all graphs at once.
- A negative Cash Balance means Payment Out exceeds Payment In — check which projects are drawing cash.
- A negative Budget Remaining means expenses have exceeded the Project Value — flag this to the project team immediately.
- The Project-wise Summary status filter defaults to Ongoing. Switch to All to see the full picture including completed projects.
If Something Goes Wrong
| Problem | Likely Cause | What to Do |
|---|---|---|
| Dashboard showing no data | Date range excludes your data | Adjust the date filter to a wider range |
| Project not appearing in Project-wise Summary | Status filter excludes it | Change the Status filter to match the project’s current status |
| Sales or Expense graph appears empty | No transactions in the selected period | Check the date range or confirm transactions exist in the Transaction tab |
| Cash Balance looks incorrect | Payment or sales entries missing | Review recent transactions in the Finance tab |