
How to Track Labour Productivity in Onsite
Onsite does not have a dedicated Labour Productivity report. Productivity can be tracked and calculated by combining data from five modules: the Task Resources tab, task progress with attendance hours, the DPR, Team Schedule timesheets, and the Party Ledger. This article explains each method and when to use it.
Before You Start
For any productivity tracking to work, two things must happen consistently:
- Attendance must be marked daily with task assignments. When a worker is marked Present and assigned to a task with work hours, those hours flow into the task’s Actual Labour Qty automatically. Without task assignments on attendance entries, the Resources tab shows zero actual labour.
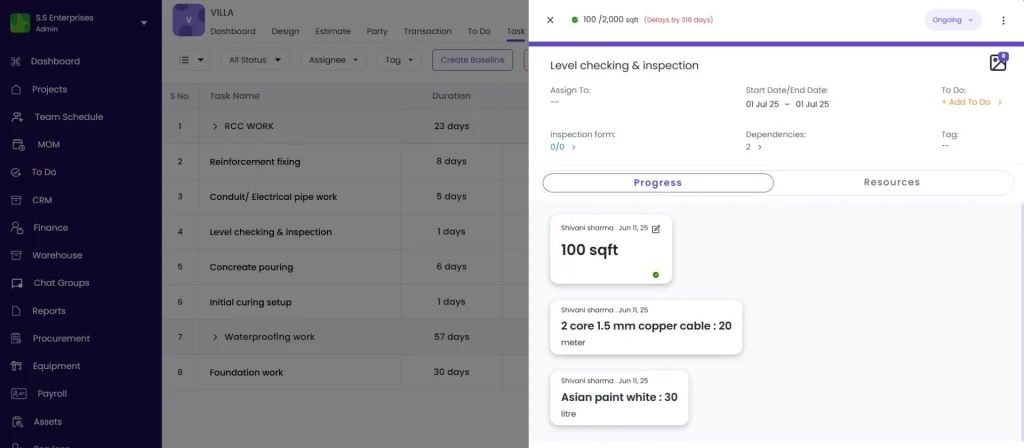
- Task progress must be updated with quantities. Without progress entries showing how much work was done (sqft, nos, RMT), there is nothing to compare the labour hours against.
Method 1 — Task Resources Tab (Budget vs Actual Labour)
This is the most precise method. The Task Resources tab shows budgeted, planned, and actual labour consumption per task in one view.
How to access: Open the project, click the Task tab, click on any task, open the Resources tab, and click the Labour sub-tab.
Columns:
| Column | What It Shows |
|---|---|
| Budget Qty | Planned labour hours or units set when the task was configured |
| Planned Qty | Expected labour based on current task progress percentage |
| Actual Qty | Real labour consumed — auto-pulled from Attendance entries linked to this task |
| Exceeded Qty | How much Actual Qty has gone over Budget Qty (shown in red when positive) |
How to read the data:
If Actual Qty is lower than Planned Qty for the same task progress percentage, the team is working efficiently — using less labour than expected for the work done.
If Actual Qty exceeds Planned Qty, the team is consuming more labour than planned for the current progress level. This signals a productivity issue on that task.
⚠️ This method only works if attendance is marked daily with task assignments. Task assignment on the attendance entry is what populates Actual Qty automatically. Without it, Actual Qty always shows zero.
Method 2 — Task Progress and Attendance Hours
Use this to manually calculate a productivity rate for a specific task.
Step 1 — Get total man-hours for the task:
Go to the project, click the Attendance tab, and filter by the task or date range. Note the number of workers and hours worked per day on the relevant task.
Calculate: Number of Workers x Hours per Day x Number of Days = Total Man-Hours
Step 2 — Get quantity completed for the task:
Go to the Task tab, click the task, and read the Progress Qty from the most recent progress entry.
Step 3 — Calculate productivity:
Productivity = Quantity Completed divided by Total Man-Hours
Example:
| Input | Value |
|---|---|
| Quantity completed | 200 sqft of brickwork |
| Workers on task | 4 masons |
| Hours per day | 8 hours |
| Days worked | 5 days |
| Total Man-Hours | 4 x 8 x 5 = 160 man-hours |
| Productivity Rate | 200 sqft divided by 160 hours = 1.25 sqft per man-hour |
Compare this rate against your project benchmark or industry standard. If your benchmark is 1.5 sqft per man-hour, the team is running at 83% efficiency.
Method 3 — DPR (Daily Progress Report)
The DPR provides a ready-made daily snapshot of labour deployed and work completed, without any manual calculation.
How to generate: Go to the Task tab, click Download, select DPR, set the date range, and click Download PDF.
What the DPR shows for productivity:
| DPR Section | What It Contains |
|---|---|
| Work Summary | Tasks updated for the day with progress percentage |
| Labour Report | Labour contractor, workforce type, number of workers, shift, and overtime hours |
Compare the Labour Report (how many workers and shifts) against the Work Summary (how much progress was achieved) to assess daily productivity qualitatively.
Best used for: Daily reporting to management or clients. The DPR is the most shareable productivity snapshot as it combines labour and progress in a single PDF.
Method 4 — Timesheet (Team Schedule)
Track total hours logged per staff member per project over a period.
How to access: Click Team Schedule in the left sidebar, then click the Timesheet tab.
Filters: Project, Date, Team Member.
Each row shows the person, project, date, hours logged, and notes. Use this to:
- See total hours any staff member has logged on a project in a period
- Compare hours logged across team members for the same period
- Identify team members who are not logging hours consistently
💡 Timesheet hours are manually logged entries — they are separate from the attendance-linked hours that flow into the Task Resources tab. Use both for a complete view: attendance for headcount and task-linked labour, timesheets for professional or managerial staff who log their own hours.
Method 5 — Labour Cost vs Work Done (Party Ledger)
Use this to calculate cost efficiency per unit of completed work — the cost per sqft, per RMT, or per nos.
Step 1 — Get the labour cost for the period:
Go to the project, click the Party tab, and open the relevant labour contractor or staff member’s ledger. Note the total Salary Expense for the period.
Alternatively, use the Company Expense Report (Reports section) filtered by project and cost code “Labour” to get total labour spend.
Step 2 — Get the quantity completed:
Go to the Task tab and read the cumulative Progress Qty for the relevant tasks.
Step 3 — Calculate cost per unit:
Cost per Unit = Total Labour Cost divided by Quantity Completed
Example:
| Input | Value |
|---|---|
| Total labour cost for the month | Rs 1,20,000 |
| Brickwork completed | 2,400 sqft |
| Cost per sqft | Rs 1,20,000 divided by 2,400 = Rs 50 per sqft |
Compare against your BOQ rate for brickwork labour to see if the project is within budget.
Tips
- Method 1 (Task Resources) is the most automated. Once attendance is consistently marked with task assignments, Actual Qty updates without any manual calculation.
- The biggest barrier to accurate productivity tracking is incomplete attendance. If the site team does not mark attendance daily with task assignments, all resource data is zero. Make daily attendance with task tagging a non-negotiable site practice.
- Use Method 2 for a quick spot-check on a specific task. Use Method 1 for ongoing tracking across all tasks.
- Use the DPR for client-facing reporting. It combines labour and progress in a readable format that does not require the client to log into Onsite.
- Use Method 5 at the end of each billing period to verify that the labour cost per unit completed is within the BOQ estimate. This catches cost overruns before they compound.
- Cross-check Method 1 and Method 2. If the Task Resources tab shows a different actual hours number than your manual calculation, check whether all attendance entries for the task period were saved with task assignments.
If Something Goes Wrong
| Problem | Likely Cause | What to Do |
|---|---|---|
| Task Resources Labour showing zero Actual Qty | Attendance not marked with task assignments | Go to the Attendance tab, edit each attendance entry, and assign it to the relevant task |
| DPR Labour Report showing no workers | No attendance marked for the selected date | Mark attendance for that date first |
| Productivity rate unusually low | Workers marked Present but no task progress entries | Ensure the site team is also updating task progress regularly |
| Timesheet hours and attendance hours not matching | They are different systems | Attendance hours feed Task Resources; Timesheet is a separate manual log. Both can be valid. |
| Cannot see party ledger for a contractor | Contractor not added to the project | Add the party to the project via the Party tab first |